Benchmark your performance patches
01 May 2012
After a dozen performance patches to many gems want to share some practical experience I gain. Tools I’ve picked up was perftools.rb and ruby built-in benchmark library. They are fit well for cases when optimization stays at Ruby level and doesn’t require to fix something in native extensions or dig into IO operations.
General flow on how to tackle performance is clear:
- perftools.rb shows slow method calls in a nice call graph format.
- Benchmark proves that we made an improvement.
Perftools does all the hard work for you.
require 'perftools'
PerfTools::CpuProfiler.start("/tmp/profile_result") do
  # code to profile
end
Run test and open result:
gem install perftools.rb
ruby test.rb
pprof.rb --gif /tmp/profile_result > /tmp/profile_result.gif
$IMAGE_VIEWER /tmp/profile_result.gif
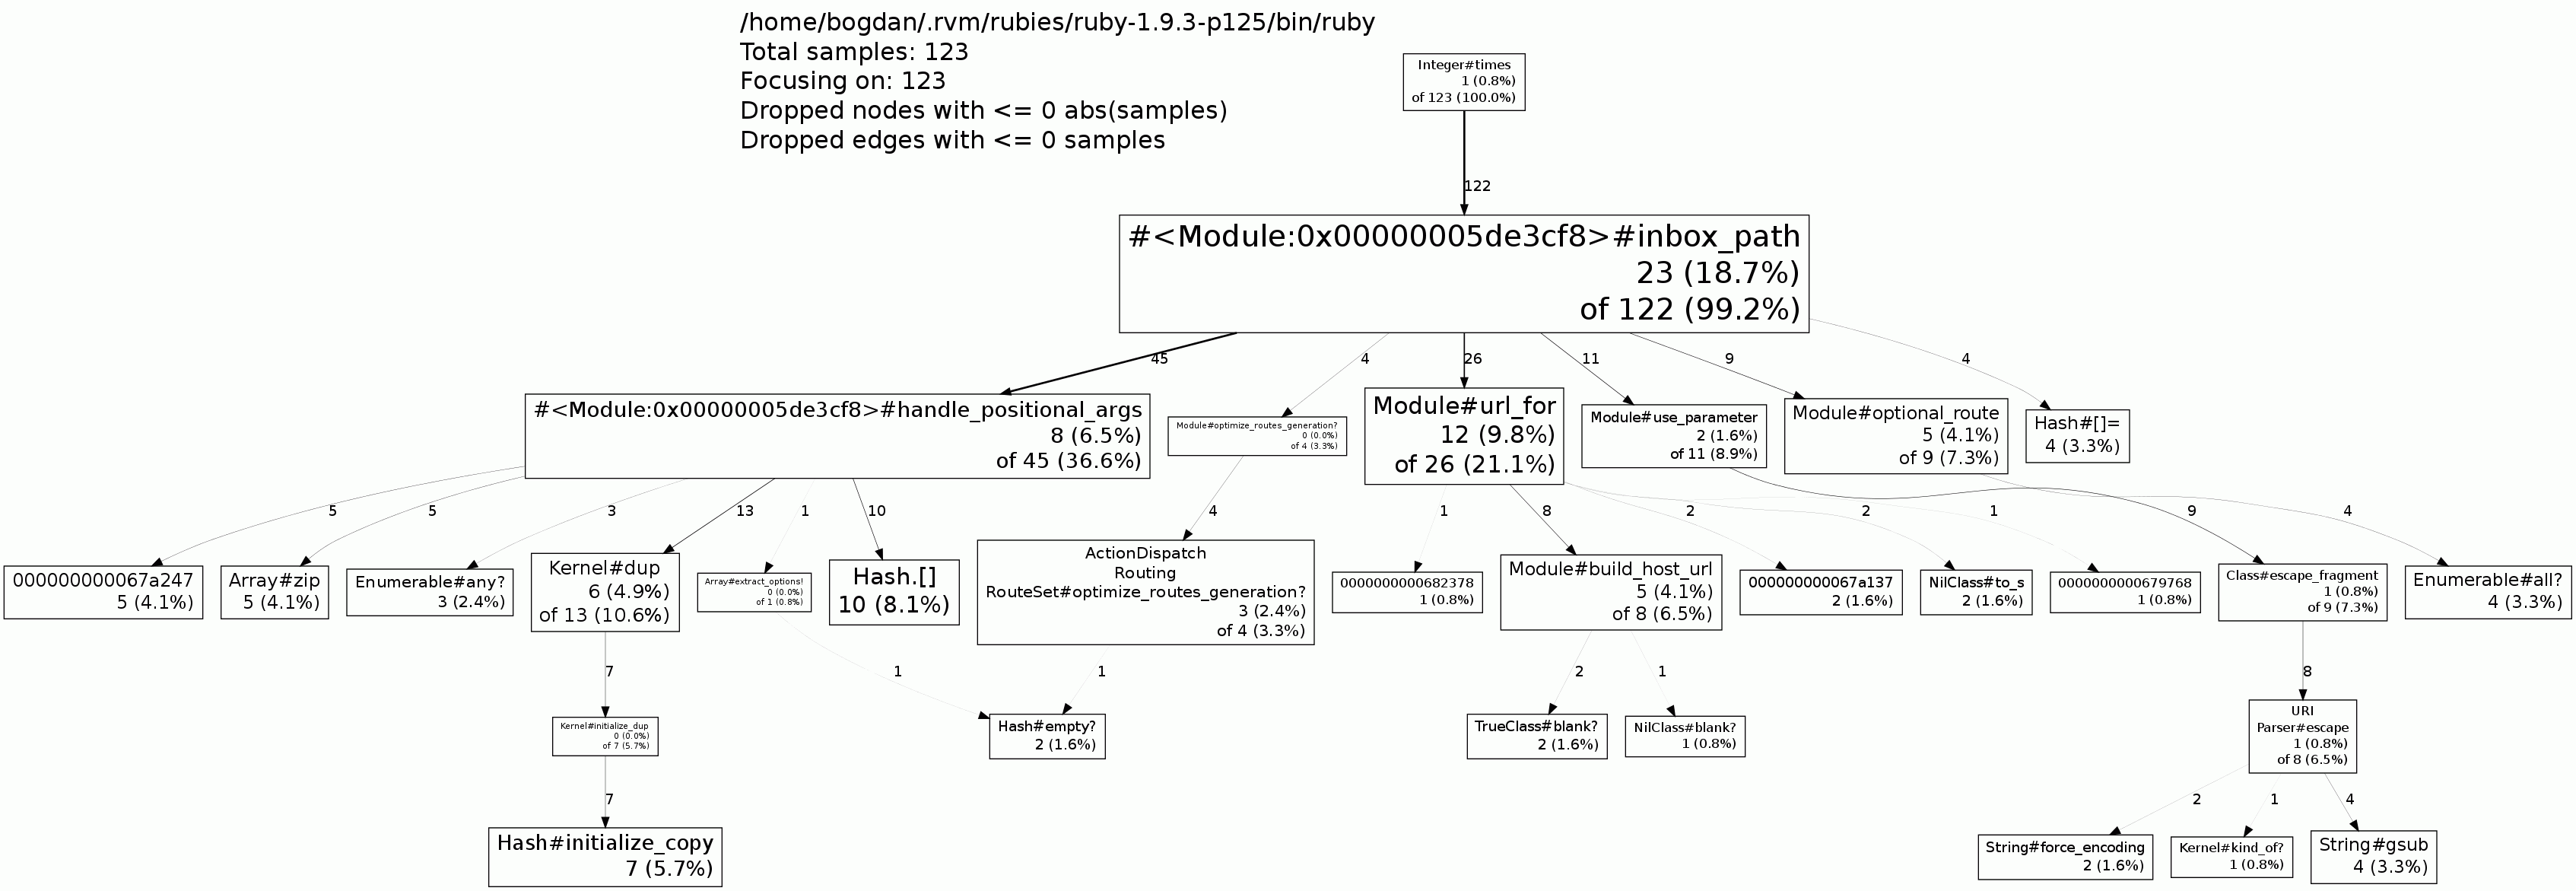
Example output: Rails route generator call graph
Here is short instruction how to read call graph:
Each block represents a method that was called. Percentage in a block shows how much time was spend in current method with and without all it’s nested calls comparing to overall time. Arrow with number shows how many times parent method called it’s children method.
That’s it. All you need to do now is find blocks with most percentage and try reduce them.
This flow works fine till the moment when benchmark results before and after patch should be compared. Ruby Benchmark can not merge them together and represent in a human readable form like this:
Running benchmark with current working tree
Checkout HEAD^
Running benchmark with HEAD^
Checkout to previous HEAD again

                    user     system      total        real
----------------------------------headers parsing when long
After patch:    0.100000   0.000000   0.100000 (  0.089926)
Before patch:   0.700000   0.000000   0.700000 (  0.697444)

----------------------------------headers parsing when tiny
After patch:    0.000000   0.000000   0.000000 (  0.009930)
Before patch:   0.020000   0.000000   0.020000 (  0.024283)

---------------------------------headers parsing when empty
After patch:    0.010000   0.000000   0.010000 (  0.002160)
Before patch:   0.000000   0.000000   0.000000 (  0.002354)
So, decided to create a library that fixes this problem. Try out DiffBench if you ever come up with performance patch.
DiffBench in action examples:


